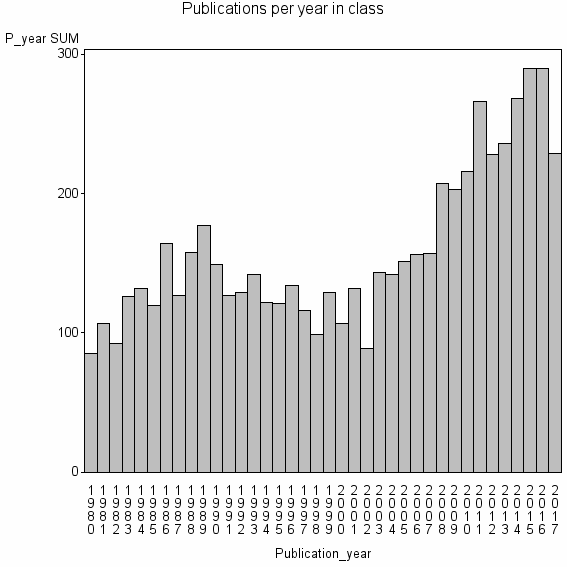
Class information for: |
Basic class information |

Hierarchy of classes |
The table includes all classes above and classes immediately below the current class. |
Terms with highest relevance score |
| rank | Category | termType | chi_square | shrOfCwithTerm | shrOfTermInClass | termInClass |
|---|---|---|---|---|---|---|
| 1 | INTERNATIONAL JOURNAL OF FORECASTING | journal | 1159156 | 10% | 38% | 591 |
| 2 | JOURNAL OF FORECASTING | journal | 947806 | 8% | 38% | 481 |
| 3 | FORECAST EVALUATION | authKW | 304486 | 2% | 56% | 105 |
| 4 | FORECASTING | authKW | 246959 | 8% | 10% | 491 |
| 5 | EXPONENTIAL SMOOTHING | authKW | 202540 | 1% | 45% | 87 |
| 6 | MACROECONOMIC FORECASTING | authKW | 174418 | 1% | 73% | 46 |
| 7 | DYNAMIC FACTOR MODEL | authKW | 166119 | 1% | 44% | 72 |
| 8 | FORECAST COMBINATION | authKW | 158348 | 1% | 50% | 61 |
| 9 | ECONOMICS | WoSSC | 153366 | 54% | 1% | 3274 |
| 10 | FACTOR MODELS | authKW | 151476 | 2% | 26% | 111 |
Web of Science journal categories |
| chi_square_rank | Category | chi_square | shrOfCwithTerm | shrOfTermInClass | termInClass |
|---|---|---|---|---|---|
| 1 | Economics | 153366 | 54% | 1% | 3274 |
| 2 | Statistics & Probability | 90605 | 30% | 1% | 1815 |
| 3 | Social Sciences, Mathematical Methods | 88226 | 15% | 2% | 909 |
| 4 | Management | 60037 | 22% | 1% | 1333 |
| 5 | Mathematics, Interdisciplinary Applications | 6598 | 8% | 0% | 479 |
| 6 | Business, Finance | 4894 | 4% | 0% | 269 |
| 7 | Operations Research & Management Science | 4658 | 7% | 0% | 406 |
| 8 | Computer Science, Interdisciplinary Applications | 793 | 4% | 0% | 227 |
| 9 | Mathematical & Computational Biology | 605 | 2% | 0% | 131 |
| 10 | Business | 471 | 2% | 0% | 119 |
Address terms |
| chi_square_rank | term | chi_square | shrOfCwithTerm | shrOfTermInClass | termInClass |
|---|---|---|---|---|---|
| 1 | LANCASTER FORECASTING | 36959 | 0% | 65% | 11 |
| 2 | ECON | 35698 | 14% | 1% | 873 |
| 3 | FORECASTING SYST UNIT | 23369 | 0% | 75% | 6 |
| 4 | ECA | 16312 | 1% | 9% | 36 |
| 5 | BUSINESS CONDIT MACROECON FORECASTING DIRECTORA | 15581 | 0% | 100% | 3 |
| 6 | ECON MODELLING FORECASTING | 15581 | 0% | 100% | 3 |
| 7 | ECONOMETR BUSINESS STAT | 15443 | 1% | 8% | 36 |
| 8 | TIME SERIES ANAL | 13847 | 0% | 67% | 4 |
| 9 | ECONOMETR | 13190 | 1% | 4% | 69 |
| 10 | IGIER | 12796 | 0% | 10% | 24 |
Journals |
| chi_square_rank | term | chi_square | shrOfCwithTerm | shrOfTermInClass | termInClass |
|---|---|---|---|---|---|
| 1 | INTERNATIONAL JOURNAL OF FORECASTING | 1159156 | 10% | 38% | 591 |
| 2 | JOURNAL OF FORECASTING | 947806 | 8% | 38% | 481 |
| 3 | JOURNAL OF BUSINESS & ECONOMIC STATISTICS | 102428 | 3% | 12% | 168 |
| 4 | JOURNAL OF ECONOMETRICS | 57107 | 3% | 6% | 200 |
| 5 | JOURNAL OF TIME SERIES ANALYSIS | 47693 | 1% | 11% | 84 |
| 6 | JOURNAL OF APPLIED ECONOMETRICS | 40379 | 2% | 8% | 99 |
| 7 | OXFORD BULLETIN OF ECONOMICS AND STATISTICS | 19604 | 1% | 6% | 69 |
| 8 | BIOMETRIKA | 17724 | 2% | 3% | 106 |
| 9 | EMPIRICAL ECONOMICS | 16111 | 1% | 5% | 61 |
| 10 | ECONOMIA CHILENA | 14833 | 0% | 17% | 17 |
Author Key Words |
Core articles |
The table includes core articles in the class. The following variables is taken into account for the relevance score of an article in a cluster c: (1) Number of references referring to publications in the class. (2) Share of total number of active references referring to publications in the class. (3) Age of the article. New articles get higher score than old articles. (4) Citation rate, normalized to year. |
Classes with closest relation at Level 2 |