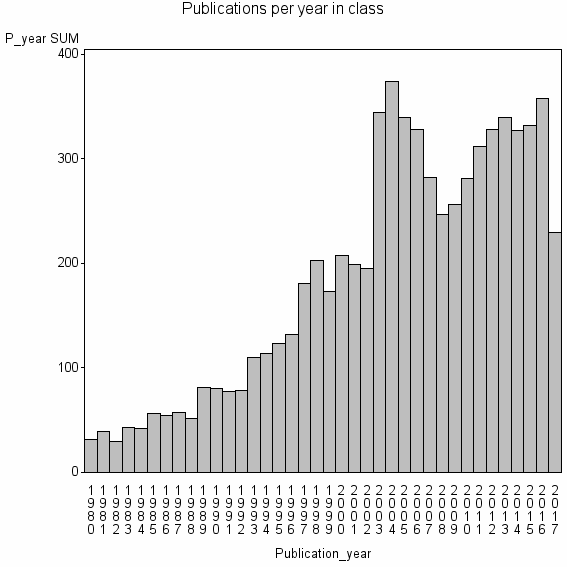
Class information for: |
Basic class information |

Hierarchy of classes |
The table includes all classes above and classes immediately below the current class. |
Terms with highest relevance score |
| rank | Category | termType | chi_square | shrOfCwithTerm | shrOfTermInClass | termInClass |
|---|---|---|---|---|---|---|
| 1 | EXPERIMENTAL EVOLUTION | authKW | 360106 | 4% | 31% | 262 |
| 2 | EVOLUTIONARY COMPUTATION | journal | 337608 | 3% | 39% | 194 |
| 3 | RUNTIME ANALYSIS | authKW | 244583 | 1% | 73% | 75 |
| 4 | GENETIC PROGRAMMING | authKW | 198126 | 4% | 17% | 255 |
| 5 | FITNESS LANDSCAPE | authKW | 190126 | 1% | 47% | 91 |
| 6 | GENETIC PROGRAMMING AND EVOLVABLE MACHINES | journal | 178285 | 1% | 48% | 83 |
| 7 | EVOLVABLE HARDWARE | authKW | 174160 | 1% | 59% | 66 |
| 8 | ERROR THRESHOLD | authKW | 149895 | 1% | 71% | 47 |
| 9 | BENEFICIAL MUTATIONS | authKW | 131001 | 1% | 75% | 39 |
| 10 | QUASISPECIES | authKW | 125062 | 2% | 24% | 118 |
Web of Science journal categories |
| chi_square_rank | Category | chi_square | shrOfCwithTerm | shrOfTermInClass | termInClass |
|---|---|---|---|---|---|
| 1 | Computer Science, Theory & Methods | 37109 | 20% | 1% | 1428 |
| 2 | Computer Science, Artificial Intelligence | 36785 | 19% | 1% | 1361 |
| 3 | Mathematical & Computational Biology | 20351 | 10% | 1% | 715 |
| 4 | Evolutionary Biology | 18725 | 11% | 1% | 780 |
| 5 | Biology | 10810 | 12% | 0% | 816 |
| 6 | Genetics & Heredity | 9339 | 16% | 0% | 1136 |
| 7 | Virology | 3312 | 6% | 0% | 399 |
| 8 | Ecology | 2888 | 8% | 0% | 583 |
| 9 | Computer Science, Software Engineering | 2006 | 4% | 0% | 307 |
| 10 | Computer Science, Cybernetics | 1804 | 2% | 0% | 112 |
Address terms |
| chi_square_rank | term | chi_square | shrOfCwithTerm | shrOfTermInClass | termInClass |
|---|---|---|---|---|---|
| 1 | LOG SYST | 80592 | 1% | 50% | 36 |
| 2 | BEACON STUDY EVOLUT ACT | 47263 | 1% | 25% | 43 |
| 3 | DIGITAL LIFE 136 93 | 45165 | 0% | 92% | 11 |
| 4 | LS 2 | 37325 | 0% | 83% | 10 |
| 5 | BIOCOMP DEV SYST GRP | 36281 | 0% | 90% | 9 |
| 6 | DIGITAL LIFE | 34629 | 0% | 37% | 21 |
| 7 | THEORET BIOL BIOINFORMAT GRP | 34534 | 0% | 43% | 18 |
| 8 | BIOL MOL CELULAR PLANTAS | 27335 | 1% | 8% | 73 |
| 9 | COMPLEX SYST BIOL PROJECT | 26947 | 0% | 35% | 17 |
| 10 | COMP SCI 11 | 24876 | 0% | 56% | 10 |
Journals |
| chi_square_rank | term | chi_square | shrOfCwithTerm | shrOfTermInClass | termInClass |
|---|---|---|---|---|---|
| 1 | EVOLUTIONARY COMPUTATION | 337608 | 3% | 39% | 194 |
| 2 | GENETIC PROGRAMMING AND EVOLVABLE MACHINES | 178285 | 1% | 48% | 83 |
| 3 | ARTIFICIAL LIFE | 118693 | 2% | 24% | 110 |
| 4 | IEEE TRANSACTIONS ON EVOLUTIONARY COMPUTATION | 96248 | 2% | 15% | 139 |
| 5 | BIOSYSTEMS | 84256 | 3% | 8% | 227 |
| 6 | LECTURE NOTES IN COMPUTER SCIENCE | 19849 | 9% | 1% | 640 |
| 7 | EVOLUTION | 14846 | 2% | 2% | 161 |
| 8 | JOURNAL OF THEORETICAL BIOLOGY | 14767 | 3% | 2% | 193 |
| 9 | GENETICS | 12649 | 3% | 1% | 194 |
| 10 | BULLETIN OF MATHEMATICAL BIOLOGY | 5261 | 1% | 2% | 55 |
Author Key Words |
Core articles |
The table includes core articles in the class. The following variables is taken into account for the relevance score of an article in a cluster c: (1) Number of references referring to publications in the class. (2) Share of total number of active references referring to publications in the class. (3) Age of the article. New articles get higher score than old articles. (4) Citation rate, normalized to year. |
Classes with closest relation at Level 2 |