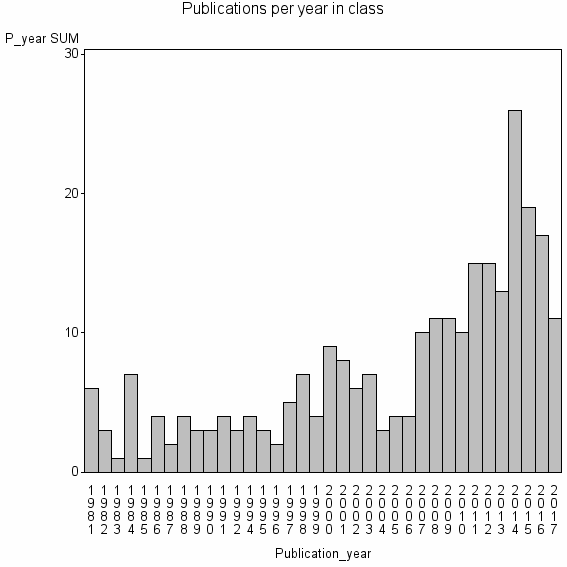
Class information for: |
Basic class information |

Hierarchy of classes |
The table includes all classes above and classes immediately below the current class. |
Terms with highest relevance score |
| rank | Category | termType | chi_square | shrOfCwithTerm | shrOfTermInClass | termInClass |
|---|---|---|---|---|---|---|
| 1 | TRANSIT RIDERSHIP | authKW | 437872 | 3% | 41% | 9 |
| 2 | PUBLIC TRANSIT RIDERSHIP | authKW | 356793 | 1% | 100% | 3 |
| 3 | COLLABORATIVE STAKEHOLDER DIALOGUE | authKW | 237862 | 1% | 100% | 2 |
| 4 | TRAVEL BEHAVIOUR MODELLING | authKW | 237862 | 1% | 100% | 2 |
| 5 | ESRC TRANSPORT STUDIES UNIT | address | 190285 | 2% | 40% | 4 |
| 6 | CHAIR INTEGRATED TRANSPORT PLANNING | address | 158573 | 1% | 67% | 2 |
| 7 | RIDERSHIP | authKW | 158565 | 2% | 22% | 6 |
| 8 | FARE | authKW | 146371 | 2% | 31% | 4 |
| 9 | 108 SERVICES | authKW | 118931 | 0% | 100% | 1 |
| 10 | ANONYRNITY DIVISIBILITY | authKW | 118931 | 0% | 100% | 1 |
Web of Science journal categories |
| chi_square_rank | Category | chi_square | shrOfCwithTerm | shrOfTermInClass | termInClass |
|---|---|---|---|---|---|
| 1 | Transportation | 68226 | 50% | 0% | 132 |
| 2 | Transportation Science & Technology | 31197 | 43% | 0% | 115 |
| 3 | Engineering, Civil | 3868 | 34% | 0% | 89 |
| 4 | Economics | 2413 | 33% | 0% | 87 |
| 5 | Urban Studies | 1382 | 8% | 0% | 21 |
| 6 | Environmental Studies | 581 | 9% | 0% | 23 |
| 7 | Geography | 192 | 4% | 0% | 11 |
| 8 | Operations Research & Management Science | 121 | 5% | 0% | 14 |
| 9 | Planning & Development | 89 | 3% | 0% | 7 |
| 10 | GREEN & SUSTAINABLE SCIENCE & TECHNOLOGY | 44 | 2% | 0% | 5 |
Address terms |
| chi_square_rank | term | chi_square | shrOfCwithTerm | shrOfTermInClass | termInClass |
|---|---|---|---|---|---|
| 1 | ESRC TRANSPORT STUDIES UNIT | 190285 | 2% | 40% | 4 |
| 2 | CHAIR INTEGRATED TRANSPORT PLANNING | 158573 | 1% | 67% | 2 |
| 3 | BUILT ENVIRONM TRANSPORT | 118931 | 0% | 100% | 1 |
| 4 | COMMUN TRANSPORTAT SCI | 118931 | 0% | 100% | 1 |
| 5 | ENGN TRANSIT ORIENTED DEV | 118931 | 0% | 100% | 1 |
| 6 | FERRIES | 118931 | 0% | 100% | 1 |
| 7 | FREEWAY MANAGEMENT | 118931 | 0% | 100% | 1 |
| 8 | HOUSEHOLDS UNIT | 118931 | 0% | 100% | 1 |
| 9 | INDIAN RAILWAY TRAFF SERV | 118931 | 0% | 100% | 1 |
| 10 | INDIAN RAILWAYS | 118931 | 0% | 100% | 1 |
Journals |
| chi_square_rank | term | chi_square | shrOfCwithTerm | shrOfTermInClass | termInClass |
|---|---|---|---|---|---|
| 1 | JOURNAL OF TRANSPORT ECONOMICS AND POLICY | 45552 | 6% | 2% | 17 |
| 2 | JOURNAL OF PUBLIC TRANSPORTATION | 32362 | 3% | 4% | 7 |
| 3 | TRANSPORTATION RESEARCH PART A-POLICY AND PRACTICE | 26557 | 9% | 1% | 23 |
| 4 | TRANSPORT POLICY | 24886 | 6% | 1% | 15 |
| 5 | TRANSPORTATION RESEARCH RECORD | 22901 | 15% | 0% | 41 |
| 6 | TRAFFIC QUARTERLY | 14863 | 1% | 6% | 2 |
| 7 | TRANSPORTATION | 13762 | 4% | 1% | 11 |
| 8 | TRANSPORT REVIEWS | 8825 | 3% | 1% | 8 |
| 9 | TRANSPORTATION RESEARCH RECORD-SERIES | 7350 | 6% | 0% | 15 |
| 10 | JOURNAL OF TRANSPORT GEOGRAPHY | 5076 | 3% | 1% | 7 |
Author Key Words |
Core articles |
The table includes core articles in the class. The following variables is taken into account for the relevance score of an article in a cluster c: (1) Number of references referring to publications in the class. (2) Share of total number of active references referring to publications in the class. (3) Age of the article. New articles get higher score than old articles. (4) Citation rate, normalized to year. |
Classes with closest relation at Level 1 |