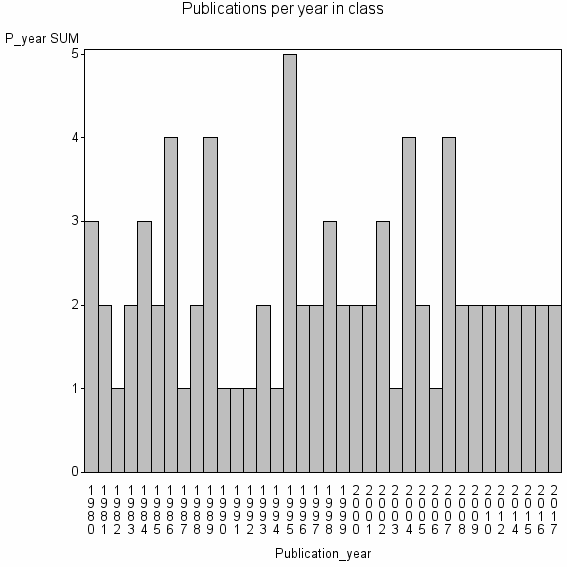
Class information for: |
Basic class information |

Hierarchy of classes |
The table includes all classes above and classes immediately below the current class. |
| Cluster id | Level | Cluster label | #P |
|---|---|---|---|
| 12 | 4 | COMPUTER SCIENCE, THEORY & METHODS//COMPUTER SCIENCE, INFORMATION SYSTEMS//COMPUTER SCIENCE, ARTIFICIAL INTELLIGENCE | 1181119 |
| 614 | 3 | JOURNAL OF QUALITY TECHNOLOGY//STATISTICAL PROCESS CONTROL//AVERAGE RUN LENGTH | 13449 |
| 2059 | 2 | STATISTICAL PROCESS CONTROL//AVERAGE RUN LENGTH//CONTROL CHARTS | 5677 |
| 37641 | 1 | RESPONSE MODELING METHODOLOGY//DISTRIBUTION FITTING//CUMULATIVE NORMAL DISTRIBUTION | 79 |
Terms with highest relevance score |
| rank | Category | termType | chi_square | shrOfCwithTerm | shrOfTermInClass | termInClass |
|---|---|---|---|---|---|---|
| 1 | RESPONSE MODELING METHODOLOGY | authKW | 2321164 | 10% | 73% | 8 |
| 2 | DISTRIBUTION FITTING | authKW | 1270328 | 14% | 29% | 11 |
| 3 | CUMULATIVE NORMAL DISTRIBUTION | authKW | 1196853 | 4% | 100% | 3 |
| 4 | SHORES APPROXIMATIONS | authKW | 797902 | 3% | 100% | 2 |
| 5 | NORMAL INTEGRAL | authKW | 598423 | 4% | 50% | 3 |
| 6 | INVERSE NORMALIZING TRANSFORMATIONS | authKW | 531933 | 3% | 67% | 2 |
| 7 | RESPONSE MODELING METHODOLOGY RMM | authKW | 531933 | 3% | 67% | 2 |
| 8 | REPEATED INTEGRALS | authKW | 512933 | 4% | 43% | 3 |
| 9 | AGRIFOOD CAMPUS INT EXCEL CEIA3 | address | 398951 | 1% | 100% | 1 |
| 10 | ANOVA FOR SINGLE GROUPED REPEATED MEASURES | authKW | 398951 | 1% | 100% | 1 |
Web of Science journal categories |
| chi_square_rank | Category | chi_square | shrOfCwithTerm | shrOfTermInClass | termInClass |
|---|---|---|---|---|---|
| 1 | Operations Research & Management Science | 1931 | 35% | 0% | 28 |
| 2 | Engineering, Industrial | 1682 | 25% | 0% | 20 |
| 3 | Statistics & Probability | 1323 | 32% | 0% | 25 |
| 4 | Computer Science, Interdisciplinary Applications | 196 | 14% | 0% | 11 |
| 5 | Engineering, Manufacturing | 96 | 6% | 0% | 5 |
| 6 | Mathematics, Applied | 83 | 14% | 0% | 11 |
| 7 | Engineering, General | 69 | 8% | 0% | 6 |
| 8 | Automation & Control Systems | 40 | 5% | 0% | 4 |
| 9 | Computer Science, Theory & Methods | 34 | 6% | 0% | 5 |
| 10 | Engineering, Chemical | 11 | 6% | 0% | 5 |
Address terms |
| chi_square_rank | term | chi_square | shrOfCwithTerm | shrOfTermInClass | termInClass |
|---|---|---|---|---|---|
| 1 | AGRIFOOD CAMPUS INT EXCEL CEIA3 | 398951 | 1% | 100% | 1 |
| 2 | ARUK EPIDEMIOL UNIT | 199474 | 1% | 50% | 1 |
| 3 | FENSKE 165 | 99736 | 1% | 25% | 1 |
| 4 | HLTH PROTECT UNIT | 19946 | 1% | 5% | 1 |
| 5 | HEALTHCARE ASSOCIATED INFECT ANTIMICROBIAL I | 11397 | 1% | 3% | 1 |
| 6 | IND ENGN MANAGEMENT | 5165 | 11% | 0% | 9 |
| 7 | DF | 4747 | 1% | 1% | 1 |
| 8 | IND ENGN | 4684 | 22% | 0% | 17 |
| 9 | DR FOSTER UNIT | 4198 | 1% | 1% | 1 |
| 10 | ENGN SCI | 3510 | 20% | 0% | 16 |
Journals |
| chi_square_rank | term | chi_square | shrOfCwithTerm | shrOfTermInClass | termInClass |
|---|---|---|---|---|---|
| 1 | IIE TRANSACTIONS | 5600 | 8% | 0% | 6 |
| 2 | AIIE TRANSACTIONS | 5463 | 1% | 1% | 1 |
| 3 | QUALITY AND RELIABILITY ENGINEERING INTERNATIONAL | 3738 | 5% | 0% | 4 |
| 4 | COMMUNICATIONS IN STATISTICS-THEORY AND METHODS | 3029 | 10% | 0% | 8 |
| 5 | COMMUNICATIONS IN STATISTICS-SIMULATION AND COMPUTATION | 1886 | 5% | 0% | 4 |
| 6 | JOURNAL OF THE ROYAL STATISTICAL SOCIETY SERIES C-APPLIED STATISTICS | 1316 | 3% | 0% | 2 |
| 7 | JOURNAL OF STATISTICAL COMPUTATION AND SIMULATION | 1311 | 4% | 0% | 3 |
| 8 | INTERNATIONAL JOURNAL OF SYSTEMS SCIENCE | 1138 | 5% | 0% | 4 |
| 9 | STATISTICIAN | 1000 | 1% | 0% | 1 |
| 10 | RAIRO-RECHERCHE OPERATIONNELLE-OPERATIONS RESEARCH | 971 | 1% | 0% | 1 |
Author Key Words |
Core articles |
The table includes core articles in the class. The following variables is taken into account for the relevance score of an article in a cluster c: (1) Number of references referring to publications in the class. (2) Share of total number of active references referring to publications in the class. (3) Age of the article. New articles get higher score than old articles. (4) Citation rate, normalized to year. |
Classes with closest relation at Level 1 |