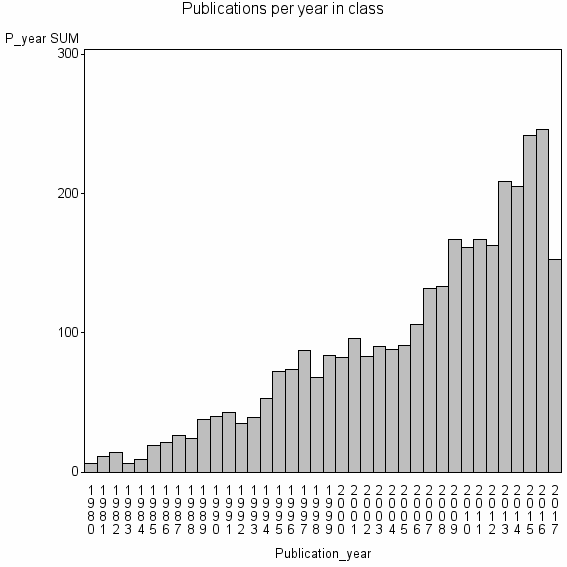
Class information for: |
Basic class information |

Hierarchy of classes |
The table includes all classes above and classes immediately below the current class. |
| Cluster id | Level | Cluster label | #P |
|---|---|---|---|
| 12 | 4 | COMPUTER SCIENCE, THEORY & METHODS//COMPUTER SCIENCE, INFORMATION SYSTEMS//COMPUTER SCIENCE, ARTIFICIAL INTELLIGENCE | 1181119 |
| 614 | 3 | JOURNAL OF QUALITY TECHNOLOGY//STATISTICAL PROCESS CONTROL//AVERAGE RUN LENGTH | 13449 |
| 2059 | 2 | STATISTICAL PROCESS CONTROL//AVERAGE RUN LENGTH//CONTROL CHARTS | 5677 |
| 511 | 1 | STATISTICAL PROCESS CONTROL//AVERAGE RUN LENGTH//CONTROL CHARTS | 3383 |
Terms with highest relevance score |
| rank | Category | termType | chi_square | shrOfCwithTerm | shrOfTermInClass | termInClass |
|---|---|---|---|---|---|---|
| 1 | STATISTICAL PROCESS CONTROL | authKW | 4673230 | 24% | 61% | 820 |
| 2 | AVERAGE RUN LENGTH | authKW | 4580358 | 16% | 90% | 545 |
| 3 | CONTROL CHARTS | authKW | 3371072 | 17% | 62% | 583 |
| 4 | QUALITY AND RELIABILITY ENGINEERING INTERNATIONAL | journal | 1248247 | 14% | 28% | 478 |
| 5 | JOURNAL OF QUALITY TECHNOLOGY | journal | 1166900 | 11% | 33% | 376 |
| 6 | ECONOMIC DESIGN | authKW | 912780 | 3% | 88% | 112 |
| 7 | AVERAGE RUN LENGTH ARL | authKW | 822031 | 3% | 95% | 93 |
| 8 | EXPONENTIALLY WEIGHTED MOVING AVERAGE | authKW | 763170 | 3% | 79% | 104 |
| 9 | AVERAGE TIME TO SIGNAL | authKW | 670758 | 2% | 99% | 73 |
| 10 | EWMA | authKW | 642645 | 3% | 59% | 116 |
Web of Science journal categories |
| chi_square_rank | Category | chi_square | shrOfCwithTerm | shrOfTermInClass | termInClass |
|---|---|---|---|---|---|
| 1 | Engineering, Industrial | 275718 | 49% | 2% | 1666 |
| 2 | Operations Research & Management Science | 155121 | 48% | 1% | 1636 |
| 3 | Statistics & Probability | 107581 | 43% | 1% | 1468 |
| 4 | Engineering, Manufacturing | 27027 | 16% | 1% | 533 |
| 5 | Engineering, General | 15674 | 17% | 0% | 567 |
| 6 | Computer Science, Interdisciplinary Applications | 3267 | 9% | 0% | 303 |
| 7 | Automation & Control Systems | 2360 | 6% | 0% | 199 |
| 8 | Computer Science, Artificial Intelligence | 370 | 3% | 0% | 114 |
| 9 | Management | 97 | 2% | 0% | 55 |
| 10 | Mathematics, Interdisciplinary Applications | 81 | 2% | 0% | 54 |
Address terms |
| chi_square_rank | term | chi_square | shrOfCwithTerm | shrOfTermInClass | termInClass |
|---|---|---|---|---|---|
| 1 | INFORMAT SYST STAT MANAGEMENT SCI | 139706 | 1% | 31% | 49 |
| 2 | IND ENGN LOGIST MANAGEMENT | 84149 | 2% | 15% | 60 |
| 3 | IBIS UVA | 82209 | 0% | 55% | 16 |
| 4 | QUAL LOGIST | 74515 | 0% | 100% | 8 |
| 5 | STAT FO TRY | 65201 | 0% | 100% | 7 |
| 6 | UNIV TECHNOL NANTES | 65201 | 0% | 100% | 7 |
| 7 | IND ENGN | 64204 | 12% | 2% | 413 |
| 8 | BUSINESS IND STAT | 57824 | 1% | 30% | 21 |
| 9 | STAT | 53643 | 19% | 1% | 634 |
| 10 | PL STAT OPERAT | 45539 | 0% | 33% | 15 |
Journals |
| chi_square_rank | term | chi_square | shrOfCwithTerm | shrOfTermInClass | termInClass |
|---|---|---|---|---|---|
| 1 | QUALITY AND RELIABILITY ENGINEERING INTERNATIONAL | 1248247 | 14% | 28% | 478 |
| 2 | JOURNAL OF QUALITY TECHNOLOGY | 1166900 | 11% | 33% | 376 |
| 3 | COMMUNICATIONS IN STATISTICS-SIMULATION AND COMPUTATION | 101527 | 6% | 6% | 192 |
| 4 | IIE TRANSACTIONS | 88287 | 5% | 6% | 156 |
| 5 | TECHNOMETRICS | 82483 | 3% | 8% | 112 |
| 6 | INTERNATIONAL JOURNAL OF PRODUCTION RESEARCH | 59502 | 7% | 3% | 236 |
| 7 | QUALITY TECHNOLOGY AND QUANTITATIVE MANAGEMENT | 56170 | 1% | 15% | 40 |
| 8 | QUALITY ENGINEERING | 48005 | 1% | 13% | 40 |
| 9 | COMPUTERS & INDUSTRIAL ENGINEERING | 38682 | 4% | 3% | 151 |
| 10 | JOURNAL OF APPLIED STATISTICS | 35366 | 3% | 4% | 98 |
Author Key Words |
Core articles |
The table includes core articles in the class. The following variables is taken into account for the relevance score of an article in a cluster c: (1) Number of references referring to publications in the class. (2) Share of total number of active references referring to publications in the class. (3) Age of the article. New articles get higher score than old articles. (4) Citation rate, normalized to year. |
Classes with closest relation at Level 1 |