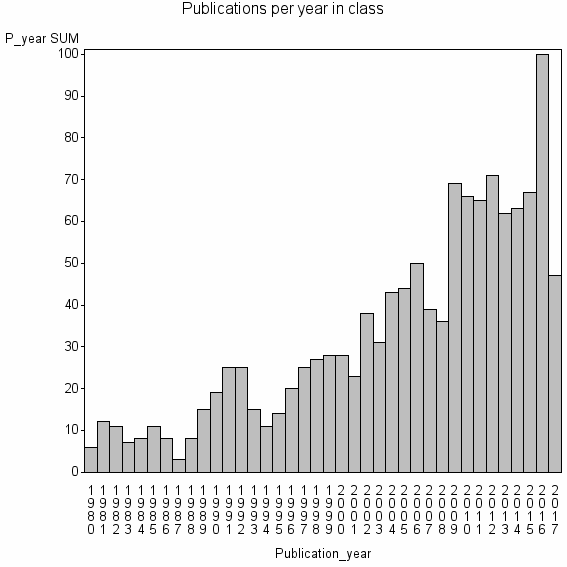
Class information for: |
Basic class information |

Hierarchy of classes |
The table includes all classes above and classes immediately below the current class. |
| Cluster id | Level | Cluster label | #P |
|---|---|---|---|
| 12 | 4 | COMPUTER SCIENCE, THEORY & METHODS//COMPUTER SCIENCE, INFORMATION SYSTEMS//COMPUTER SCIENCE, ARTIFICIAL INTELLIGENCE | 1181119 |
| 614 | 3 | JOURNAL OF QUALITY TECHNOLOGY//STATISTICAL PROCESS CONTROL//AVERAGE RUN LENGTH | 13449 |
| 2059 | 2 | STATISTICAL PROCESS CONTROL//AVERAGE RUN LENGTH//CONTROL CHARTS | 5677 |
| 8870 | 1 | PROCESS CAPABILITY INDEX//PROCESS CAPABILITY INDICES//PROCESS YIELD | 1240 |
Terms with highest relevance score |
| rank | Category | termType | chi_square | shrOfCwithTerm | shrOfTermInClass | termInClass |
|---|---|---|---|---|---|---|
| 1 | PROCESS CAPABILITY INDEX | authKW | 2637827 | 11% | 77% | 134 |
| 2 | PROCESS CAPABILITY INDICES | authKW | 2465643 | 9% | 87% | 111 |
| 3 | PROCESS YIELD | authKW | 1167498 | 5% | 75% | 61 |
| 4 | PRODUCERS RISK | authKW | 896286 | 4% | 77% | 46 |
| 5 | LOWER CONFIDENCE BOUND | authKW | 887319 | 4% | 78% | 45 |
| 6 | CONSUMERS RISK | authKW | 745482 | 4% | 67% | 44 |
| 7 | ASYMMETRIC TOLERANCES | authKW | 712470 | 2% | 97% | 29 |
| 8 | CAPABILITY INDEX | authKW | 542665 | 3% | 65% | 33 |
| 9 | PROCESS CAPABILITY ANALYSIS | authKW | 475051 | 2% | 69% | 27 |
| 10 | ACCEPTABLE QUALITY LEVEL | authKW | 473106 | 2% | 85% | 22 |
Web of Science journal categories |
| chi_square_rank | Category | chi_square | shrOfCwithTerm | shrOfTermInClass | termInClass |
|---|---|---|---|---|---|
| 1 | Engineering, Industrial | 47319 | 34% | 0% | 419 |
| 2 | Statistics & Probability | 36649 | 42% | 0% | 519 |
| 3 | Operations Research & Management Science | 26716 | 33% | 0% | 413 |
| 4 | Engineering, Manufacturing | 10391 | 16% | 0% | 200 |
| 5 | Engineering, General | 5306 | 16% | 0% | 200 |
| 6 | Materials Science, Characterization, Testing | 1623 | 5% | 0% | 58 |
| 7 | Automation & Control Systems | 1201 | 7% | 0% | 85 |
| 8 | Computer Science, Interdisciplinary Applications | 631 | 7% | 0% | 83 |
| 9 | Computer Science, Artificial Intelligence | 210 | 4% | 0% | 50 |
| 10 | Mathematics, Interdisciplinary Applications | 69 | 2% | 0% | 27 |
Address terms |
| chi_square_rank | term | chi_square | shrOfCwithTerm | shrOfTermInClass | termInClass |
|---|---|---|---|---|---|
| 1 | IND ENGN MANAGEMENT | 222747 | 19% | 4% | 234 |
| 2 | IND MANAGEMENT ENGN | 94740 | 5% | 6% | 61 |
| 3 | IUT BAYONNEUMR 5142 | 76245 | 0% | 100% | 3 |
| 4 | BUSINESS IND STAT GRP | 73247 | 1% | 41% | 7 |
| 5 | IND MANAGEMENT | 71674 | 7% | 3% | 89 |
| 6 | IND ENGN SYST MANAGEMENT | 54785 | 2% | 9% | 24 |
| 7 | IND ENGN MANAGEMENT INFORMAT | 49818 | 1% | 20% | 10 |
| 8 | QUAL TECHNOL STAT | 42352 | 0% | 33% | 5 |
| 9 | DESIGN ROBOT AUTOMAT CEDRA | 33886 | 0% | 67% | 2 |
| 10 | FLIGHT MECH ANAL | 33886 | 0% | 67% | 2 |
Journals |
| chi_square_rank | term | chi_square | shrOfCwithTerm | shrOfTermInClass | termInClass |
|---|---|---|---|---|---|
| 1 | QUALITY AND RELIABILITY ENGINEERING INTERNATIONAL | 229103 | 10% | 7% | 124 |
| 2 | JOURNAL OF QUALITY TECHNOLOGY | 174319 | 7% | 8% | 88 |
| 3 | QUALITY ENGINEERING | 47179 | 2% | 8% | 24 |
| 4 | JOURNAL OF APPLIED STATISTICS | 43873 | 5% | 3% | 66 |
| 5 | QUALITY TECHNOLOGY AND QUANTITATIVE MANAGEMENT | 38326 | 2% | 8% | 20 |
| 6 | COMMUNICATIONS IN STATISTICS-SIMULATION AND COMPUTATION | 29809 | 5% | 2% | 63 |
| 7 | JOURNAL OF TESTING AND EVALUATION | 28799 | 5% | 2% | 56 |
| 8 | COMMUNICATIONS IN STATISTICS-THEORY AND METHODS | 19240 | 6% | 1% | 80 |
| 9 | QUALITY PROGRESS | 15238 | 2% | 3% | 22 |
| 10 | INTERNATIONAL JOURNAL OF ADVANCED MANUFACTURING TECHNOLOGY | 11779 | 6% | 1% | 76 |
Author Key Words |
Core articles |
The table includes core articles in the class. The following variables is taken into account for the relevance score of an article in a cluster c: (1) Number of references referring to publications in the class. (2) Share of total number of active references referring to publications in the class. (3) Age of the article. New articles get higher score than old articles. (4) Citation rate, normalized to year. |
Classes with closest relation at Level 1 |