Some results from our electronic nose (Mark I/II). Thomas Lindblad +468730499930
This electronic nose (below) was originally developed at the Manne Siegbahn Institute (MSI) and later transferred to KTH, when I moved here. Here is the Mark I nose at MSI:
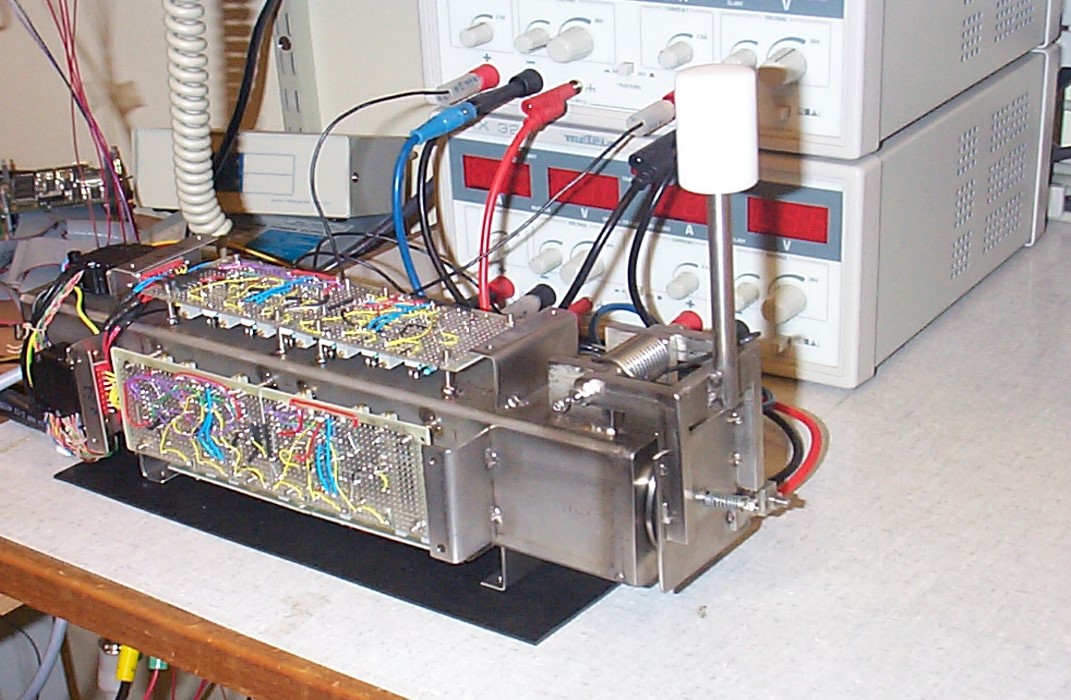
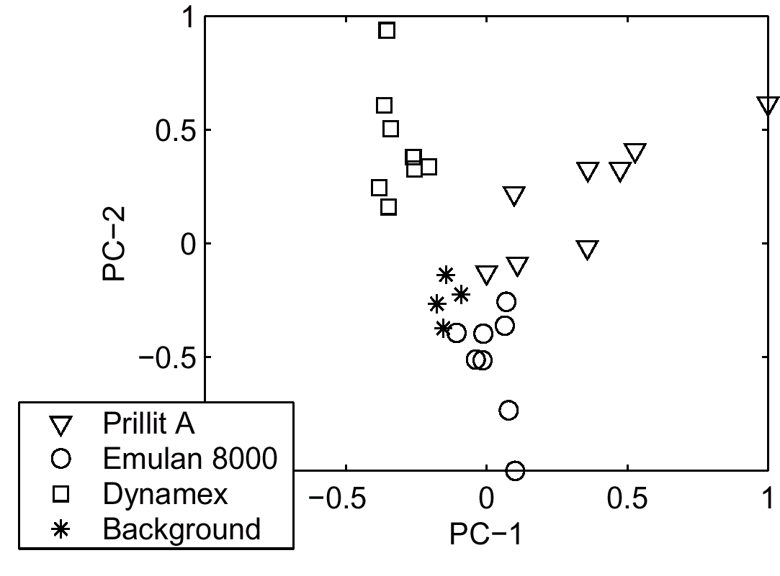
At MSI the nose was mainly used to detect and identify explosives. This project was done in collaboration with the Bomb Group of the Stockholm Police. They provided us with various types of explosives that we should identify. Some results are shown in a PCA (Principal Component Analysis) diagram below. The (three) different explosives are well separated. Note that the closer to the origin the points are, the less significant is the smell. (The background smell is marked with stars in the diagram.) Hence points close to the origin represents measurements when the exposives were placed far away from the electronic nose. We thus have a measure of the significance of the "smell".
Then we moved to KTH. The nose was a part of some students projects in a course on Environmental Physics, but also in Ph.D. work. Later the nose also received som commercial and medical attention. Ph.D. studens and participants from the Sahlgrenska University Hospital partcipated and scientific papers were published. Mark II was developed resulting in (50%) more sensors and better electronics (amplifiers and ADC:s). A collaboration with Hungarian scientists/programmers is greatly appreciated, as is the collaboration with HIOF (mainly prof. Åge Eide) in Norway.
Following help from KTH Innovation a small company was started. At some stage we were approached by a major Swedish company wanting a quailty test. Their products were sometimes mixed accidentally in batch production. Now they wanted our electronic nose to find these. Below is an example:
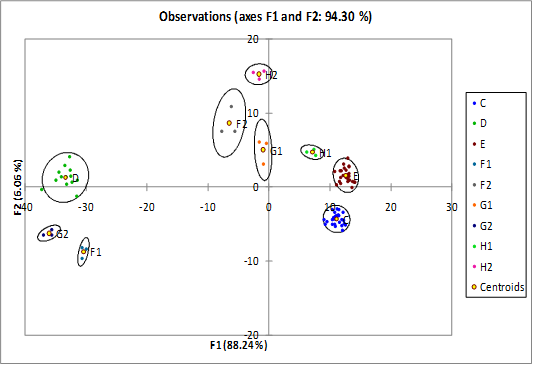
The above PCA diagram shows thre "pure" products labelled C, D and E. Fn, Gn and Hn are impure or mixed producs. The separation is good, and the tests are reproduceable as the centroids indicates. This was a first rather simle test, while the test below was aiming at some more detailed results. Note that different measurements on the same product performed in the same manner reslut in reproducable values and well defined centroids. However, when the accidental admixtures were of different origin (denoted by A01-A14) in the figure below one (probably) gets a hint of what admixure belongs to a certal Anumber.
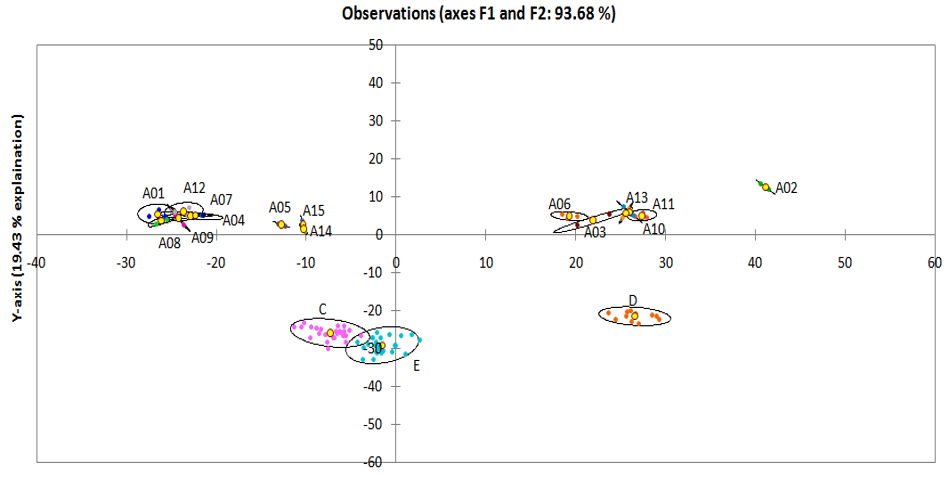
Still pretty good results! Very little overlap between different products (C,D and E). OK, C and E overlap a little bit. Note that it is a 2D PCA and that this takes care of 94% of the relevant information. Close to 100 measured quantities were converted into two numbers. In fact, if were were just to tell which batcheres are fine, we would only need say "let Y be less than -10".