Visa version
Version skapad av Tino Weinkauf 2025-04-04 12:20
Visa
< föregående
|
nästa >
Jämför
< föregående
|
nästa >
Project 2025
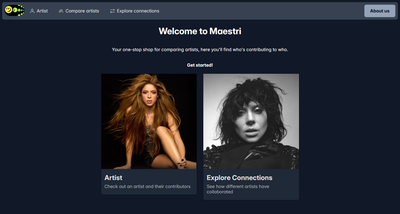
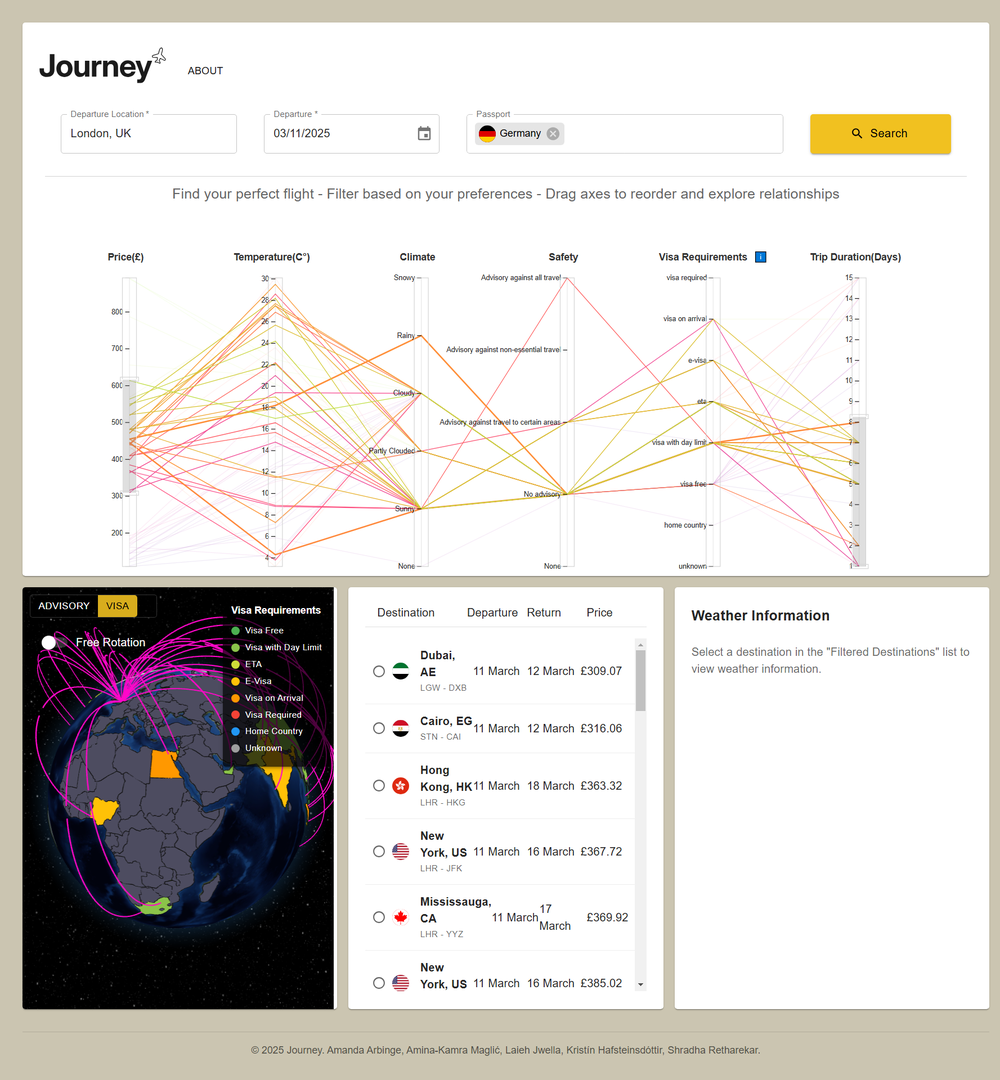
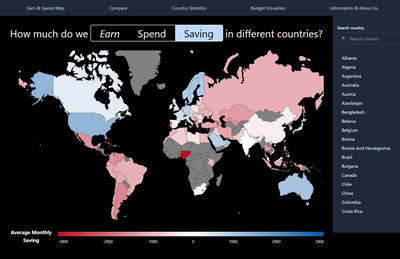
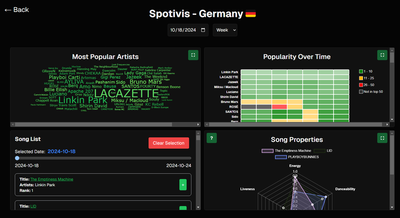
Our master students crafted excellent interactive visualizations in the re-invented course Interactive Data Visualization 2025. See for yourself below.
Final Presentations and Project Links 2025:
|
|
Slides |
Link to Project |
|
|
||
|
|
||
|
|
||
|
|
||
|
|
||
|
|
||
|
|
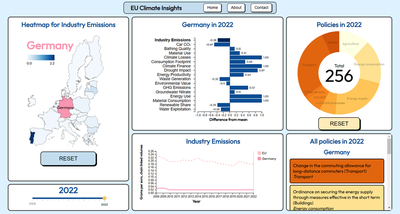
Visualizing climate-related Sustainable Development Goals in the EU |
|
|
|
Visualizing the bias in movie rating websites (code, use the command "npm start") |
|
|
|
